Sunset over power lines and transmission towers in a field.

California Deserves a Fairer System.

It’s time to

"Fix the Cost Shift" logo with stylized lightning bolt

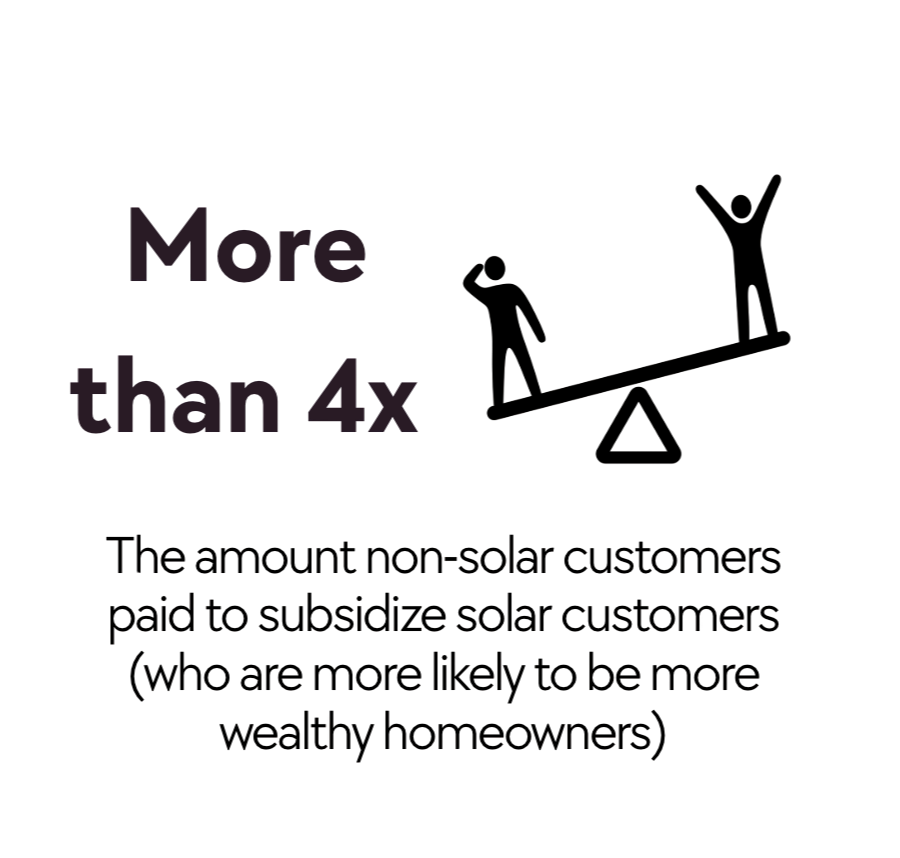
Non-Solar Customers Paid

$8.5 Billion in 2024

to Subsidize Solar Customers

Electric Bills Keep Getting Higher.

California's rooftop solar program is outdated, causing higher bills for millions of customers—including those least able to pay.

California’s Net Energy Metering (NEM) program was created in 1995 to encourage rooftop solar adoption. Three decades later, this outdated system forces those without solar to pay for massive subsidies to homeowners who can already afford solar — shifting billions of dollars annually to non-solar customers’ bills

This is one of the main drivers of increasing electricity prices, with Californians now facing the second-highest electricity bills in the entire country.

How We Fix It

Assemblymember Lisa Calderon (D-Whittier) introduced AB 942 to fix the cost shift and deliver billions in electricity bill savings for Californians. The amended AB 942 will still provide Californians with billions in savings: 

  1. When a property is sold, the new owner switches to a more equitable system — resulting in an estimated rate relief of $203 million in 2026 and $2.5 billion from 2026 to 2043.

  2. Reallocate the California Climate Credit from solar customers to non-solar customers, providing estimated rate relief of $220 million in 2026 and $1.1 billion from 2026 to 2030.

Taken together, the amended AB 942 would deliver an estimated $423 million in savings next year and $3.6 billion over the next two decades for Californians’ electricity bills.

Solar panels on a hillside with trees and a cloudy sky.
Infographic depicting $8.5 billion shifted from solar to non-solar customers in 2024, with icons of a solar panel, dollar signs, and a house.

By the Numbers….

Illustration showing a solar panel with a sun icon and the text "70%" indicating the percentage of electricity generated by solar power in certain regions.
Bar chart showing a 150% growth in cost shift from 2021 to 2024.
Infographic showing the comparison between 1.6 million subsidy beneficiaries and 10 million people who subsidize these incentives, highlighting that subsidizers are often lower-income renters.
Graphic showing a seesaw with text "More than 4x," highlighting the discrepancy in consumer path to purchase for revealed vs. hidden wealth homeowners.
Pie chart showing 21% to 27% of non-solar customers' bills subsidizing rooftop solar.
Infographic showing '2x' and a bar chart with an upward arrow and dollar sign, indicating California's electric bills are twice as high as the rest of the country.
Illustration showing text "5% to 10%" next to an icon of a bill with dollar sign, indicating potential cost reduction or savings, blurred text below.